Denoising Diffusion-Weighted Imaging Data: some comparative tests
We have been trying different software packages for the preprocessing of diffusion-weighted imaging (DWI) and comparing their results in application to our cohort data, with a particular focus set on denoising. This post gives some brief feedback on our experience and details somewhat the reasoning that led to our final selection. Those comparative tests never intended to be a systematic analysis therefore this will unlikely make it to a full paper but hopefully that might interest anyone with related methodological questions. This is also an illustration of how we manage upgrades in processing pipelines — for instance when some issue gets detected — and how we adapt our procedures for QC accordingly.
The history
We began several years ago with the overcomplete local PCA as described in [1], that has been available for many years as a Matlab toolbox and gave full satisfaction. We then looked for another possible implementation that would free us from Matlab and did some tests with the DenoiseImage command provided by ANTs, presented as a C++ version of the original spatially adaptive non-local means (NLM) described in [2].
We opted for this tool using the Rician model, in accordance with the many references describing noise in DWI as being Rician.
At some point we revised the preprocessing pipeline and added TOPUP (see here and there for some help with it) for susceptibility-induced distortion correction. Since then we started observing some issues such as voxels with negative values in mean diffusivity (MD) maps, which are normally supposed to be positive. Those negative voxels mainly appeared next to the ventricles and other areas close to cerebrospinal fluid, where diffusivity is generally the highest.
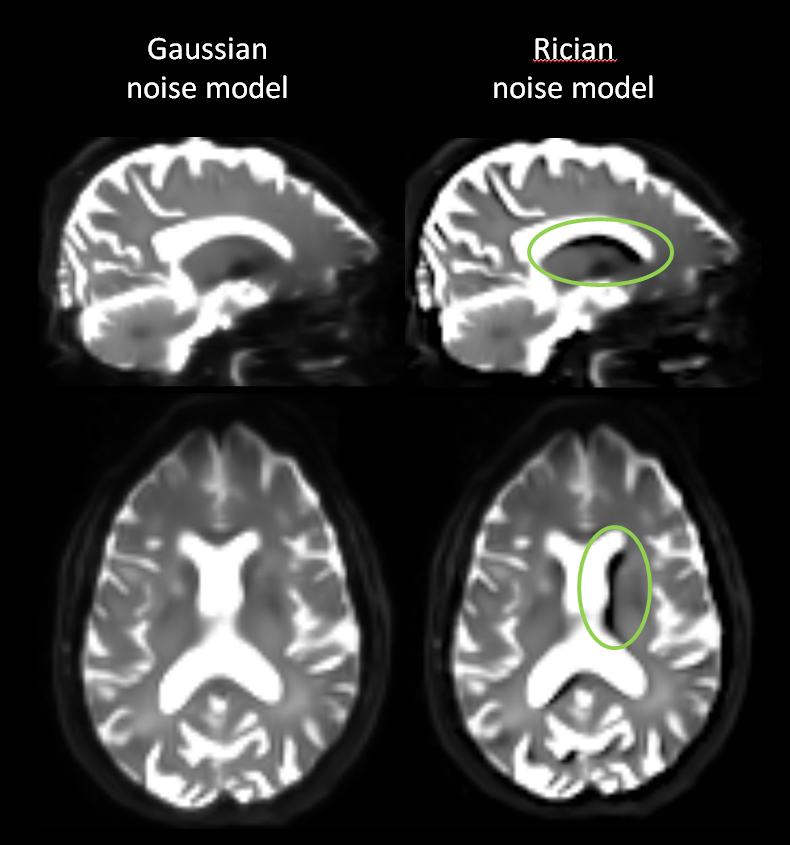
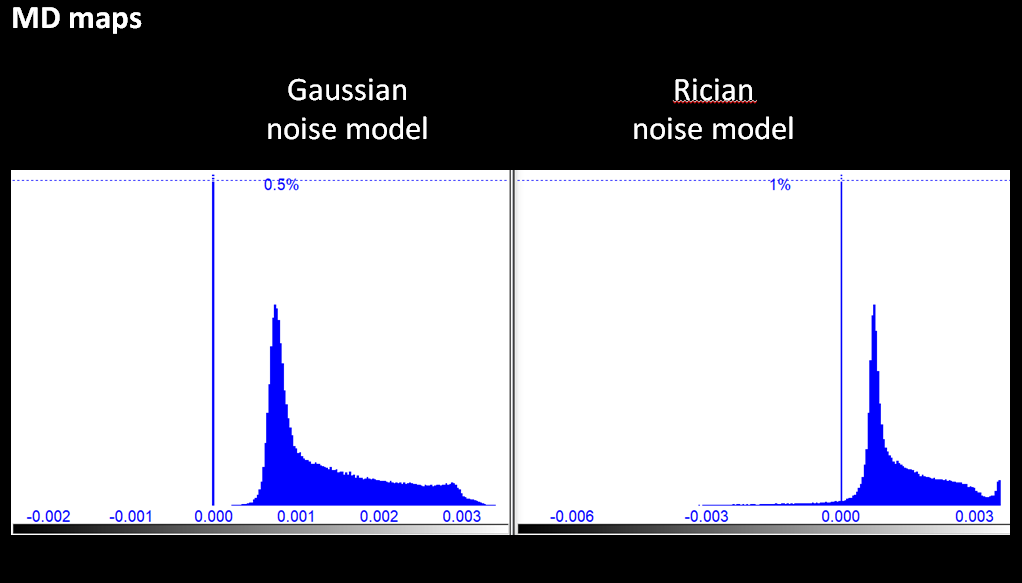
ANTs using Gaussian and Rician model - then the resulting MD map (Rician version) shows a significant amount (visible in the histogram) of voxels with negative valuesAfter some research we finally related this to a cross effect between TOPUP and ANTs' denoising using the Rician model. We switched to Gaussian model and observed that negative areas disappeared from MD maps, which would since then show a more normal profile with positive values. Instead of simply changing models and closing the issue, we took this chance to extend our investigation to some other software and potentially upgrade the pipeline with some more recent techniques.
In particular, the Marchenko-Pastur PCA [3] is regarded as a state-of-the-art technique that outperforms prior overcomplete local PCA. It has implementations in various modern packages such as dipy or mrtrix3, therefore plugging it into any processing workflow is not that of a big concern. We quickly realized that in comparison to our previous pipelines this new type of techniques combined good performance in removing noise and preserving of anatomical details.
The data
Our DWI is acquired according to the following protocol:
- 2.2 mm3 isometric voxel resolution; 66 axial slices
- FOV 230mm
- TR = 9000ms
- TE = 90ms
- b-value = 1300s/m2
- 65 directions + 8 b0 volumes
We picked ~20 random subjects and took them through the following processes:
- Denoising of DWI data by each technique in a selected set
TOPUPbased on normal and reverse-encoded B0 maps- Brain extraction of the distortion-corrected averaged b=0
image (
FSL BET) - Correction for eddy currents, subject motion and susceptibility-induced
distortions using topup estimates (
FSL eddy) - QC metric estimation derived from
TOPUPandeddytools (FSL eddyQC). - Model fitting and creation of parametric maps (
FSL DTIFIT)
We repeated the process in different versions using different software:
ANTswith Rician modelANTswith Gaussian modelCAT12with Gaussian modelmrtrix3dipy(LPCA, MPPCA, NLM, Patch2Self)- No denoising
A note on denoising the reverse-encoded B0 map before TOPUP: as the reverse-encoded B0 map is in our case acquired as a single 3D volume, we considered two options, either 1. concatenate both normal and reverse-encoded volumes and denoise them both as a single 4D volume, or 2. do not denoise the reverse-encoded B0 map and feed it as it is into TOPUP with the normal-encoded B0 map, which gets denoised along with the rest of the 65 volumes. We did not consider the third option applying TOPUP using two non-denoised B0 maps.
In case 1, all volumes go under the same processing protocol but the reverse-encoded B0 map gets denoised based on an estimation made on a "different" volume; and in case 2, that B0 map is not applied any denoising at all. We tested those two approaches with one single software; in this respect some figures show references to MRTRIX3_V1 and MRTRIX3_V2. In the end, we only kept the first one (concatenated volumes and denoised all at once).
The results
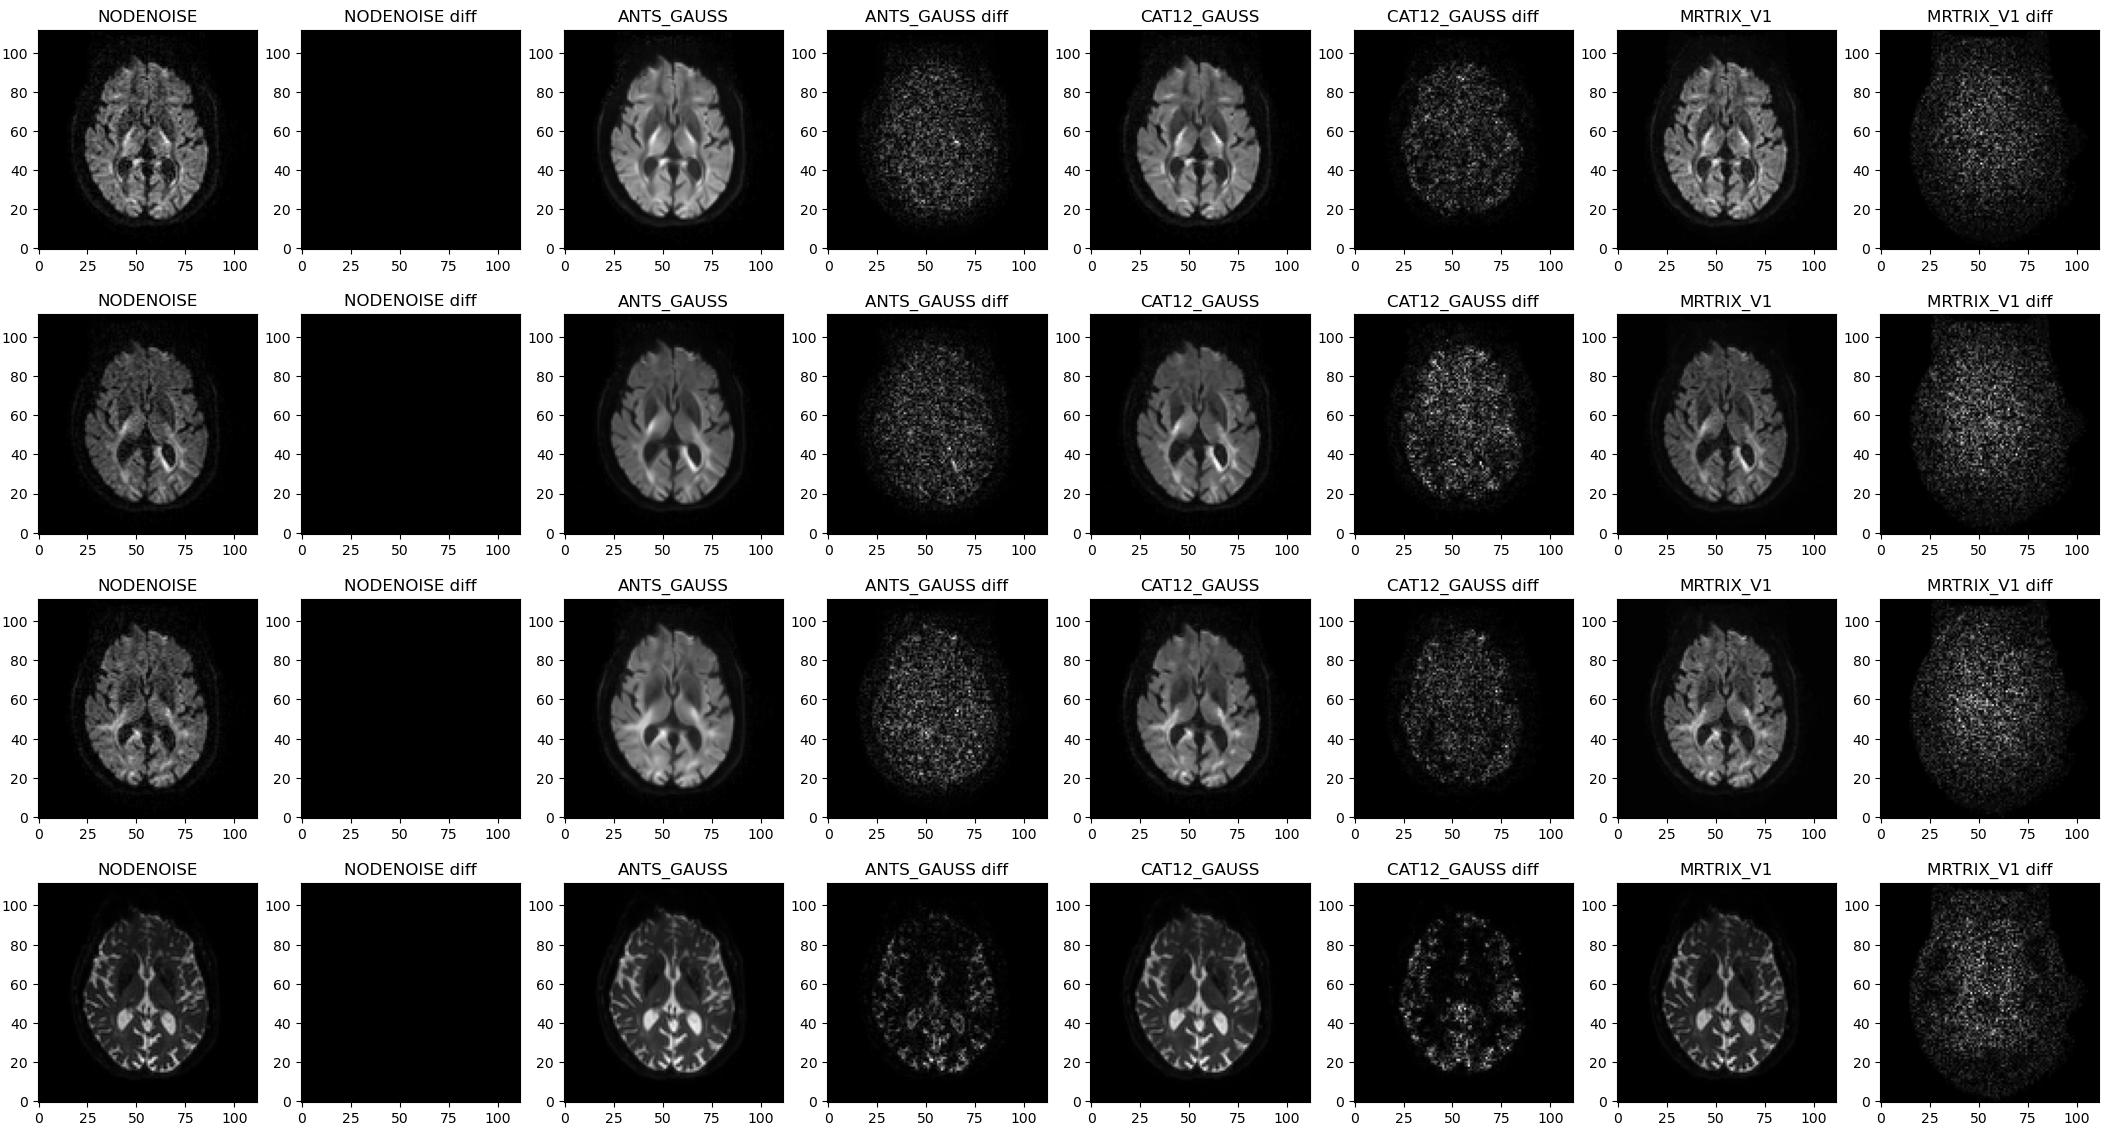
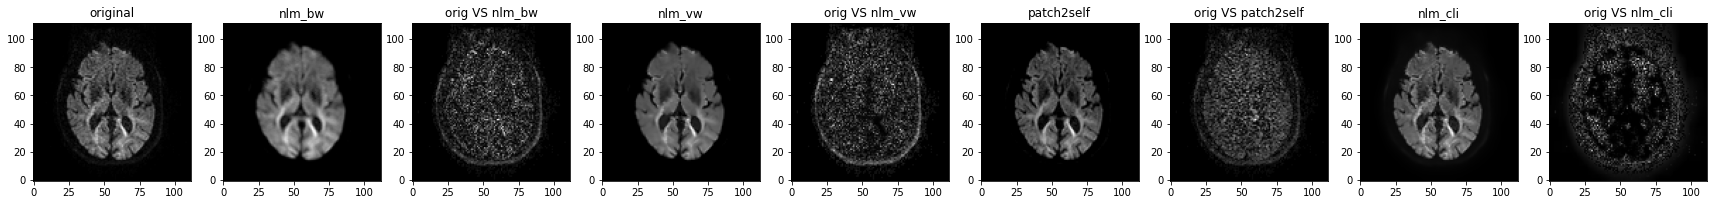
A general observation is that NLM is good at removing noise but also yields noticeably smoother resulting images. In comparison MPPCA preserves anatomical details although some noise is still visible.
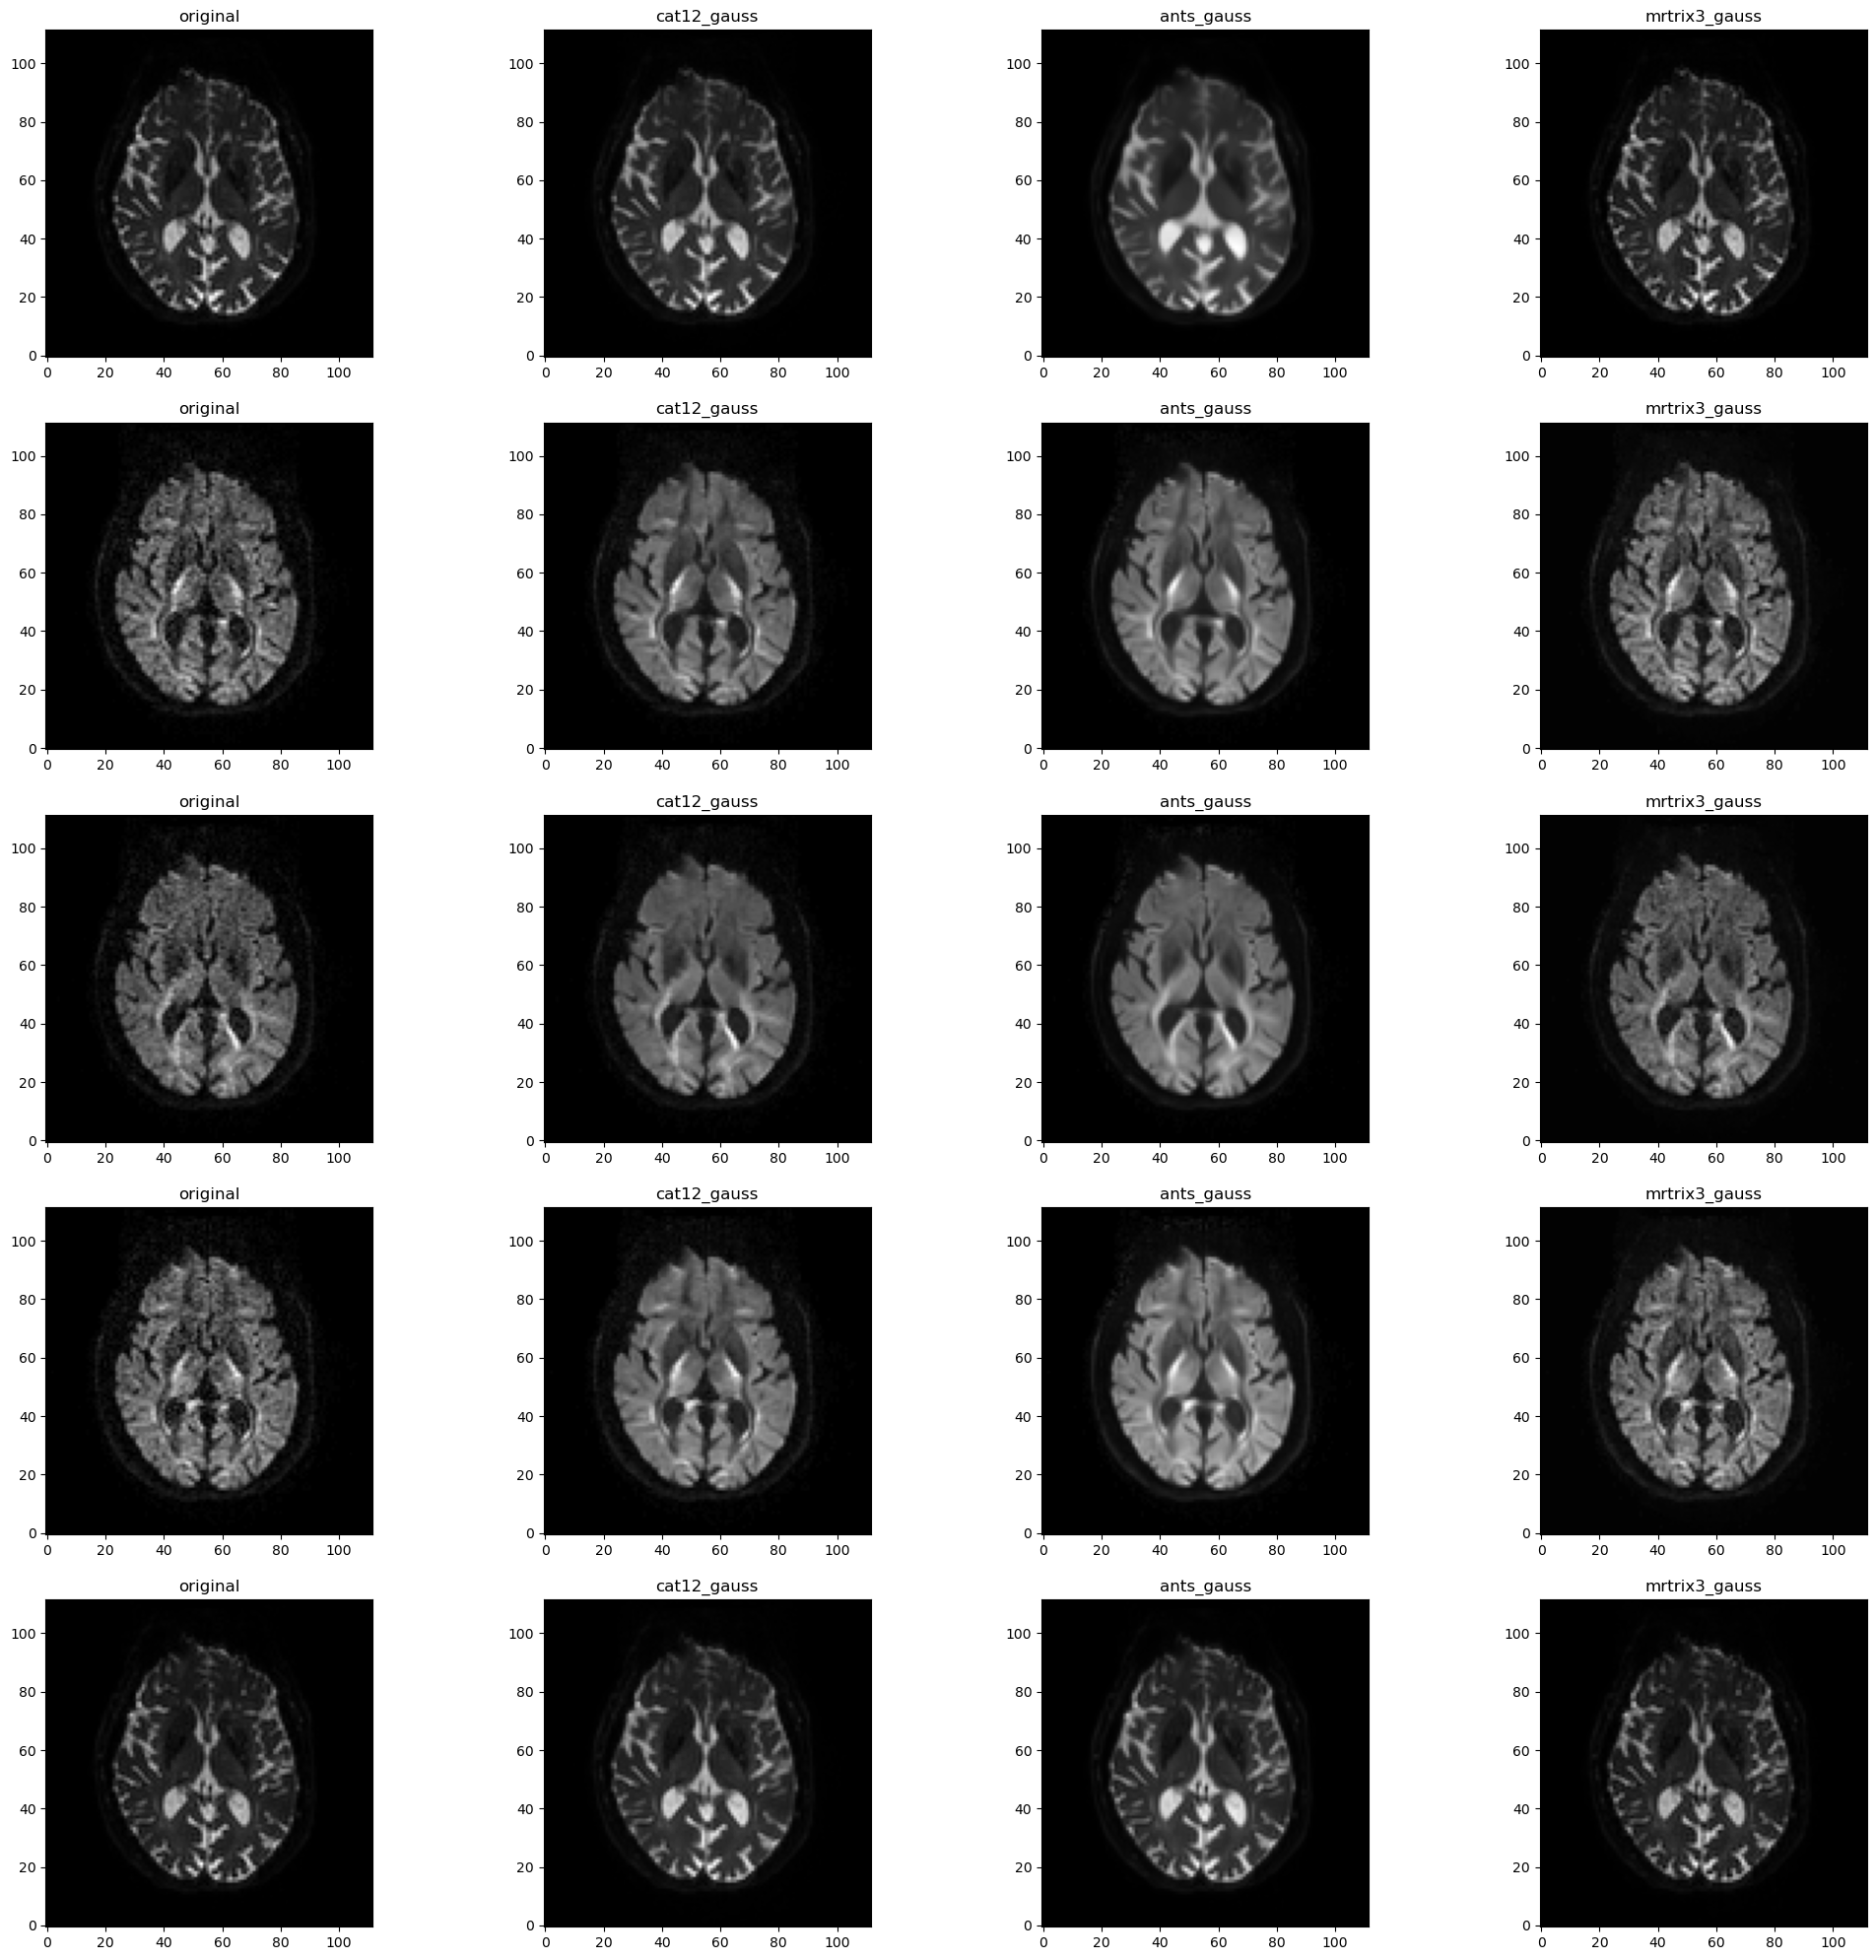
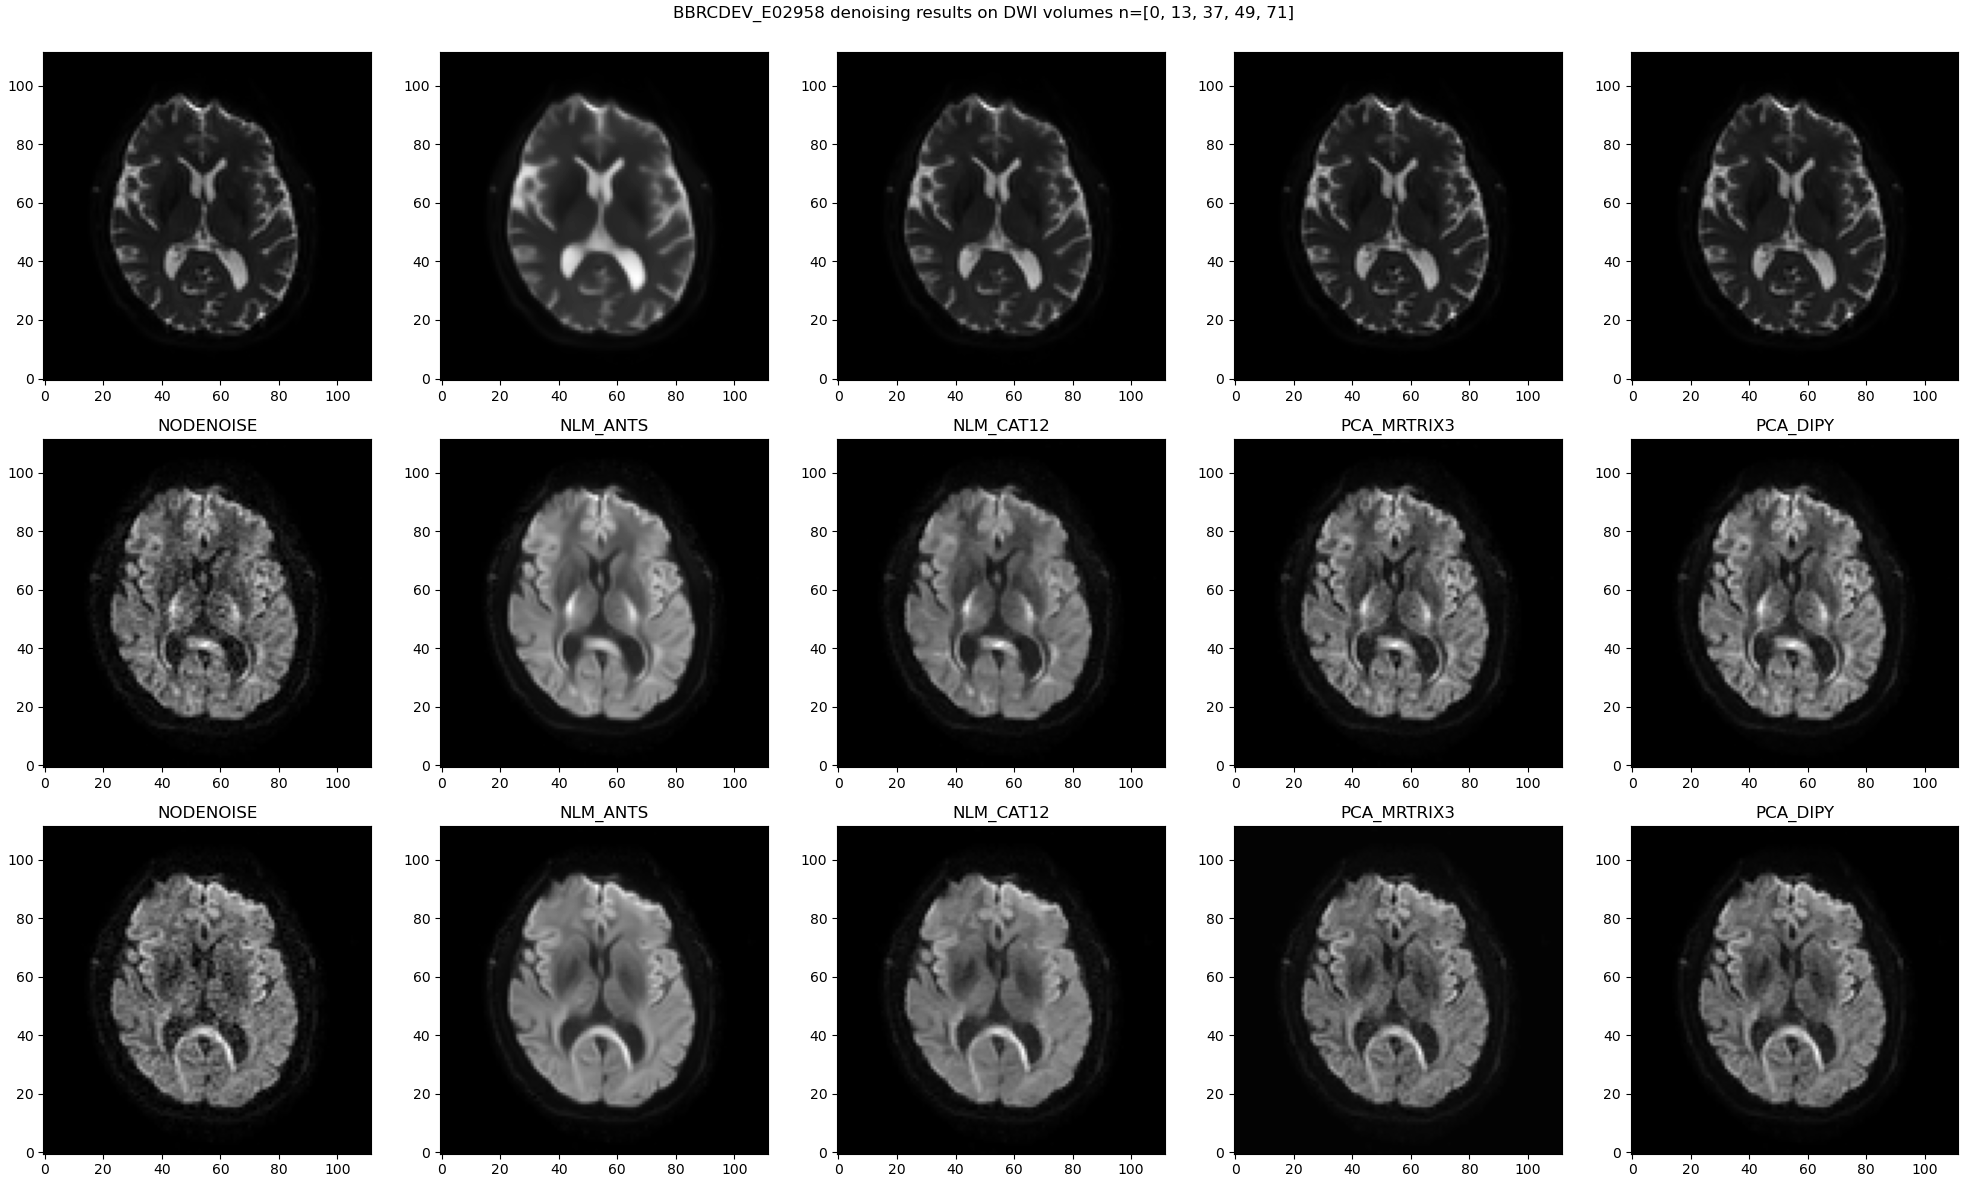
Looking at residual maps confirms that observation as less anatomical traits can be identified using MPPCA (on the right).
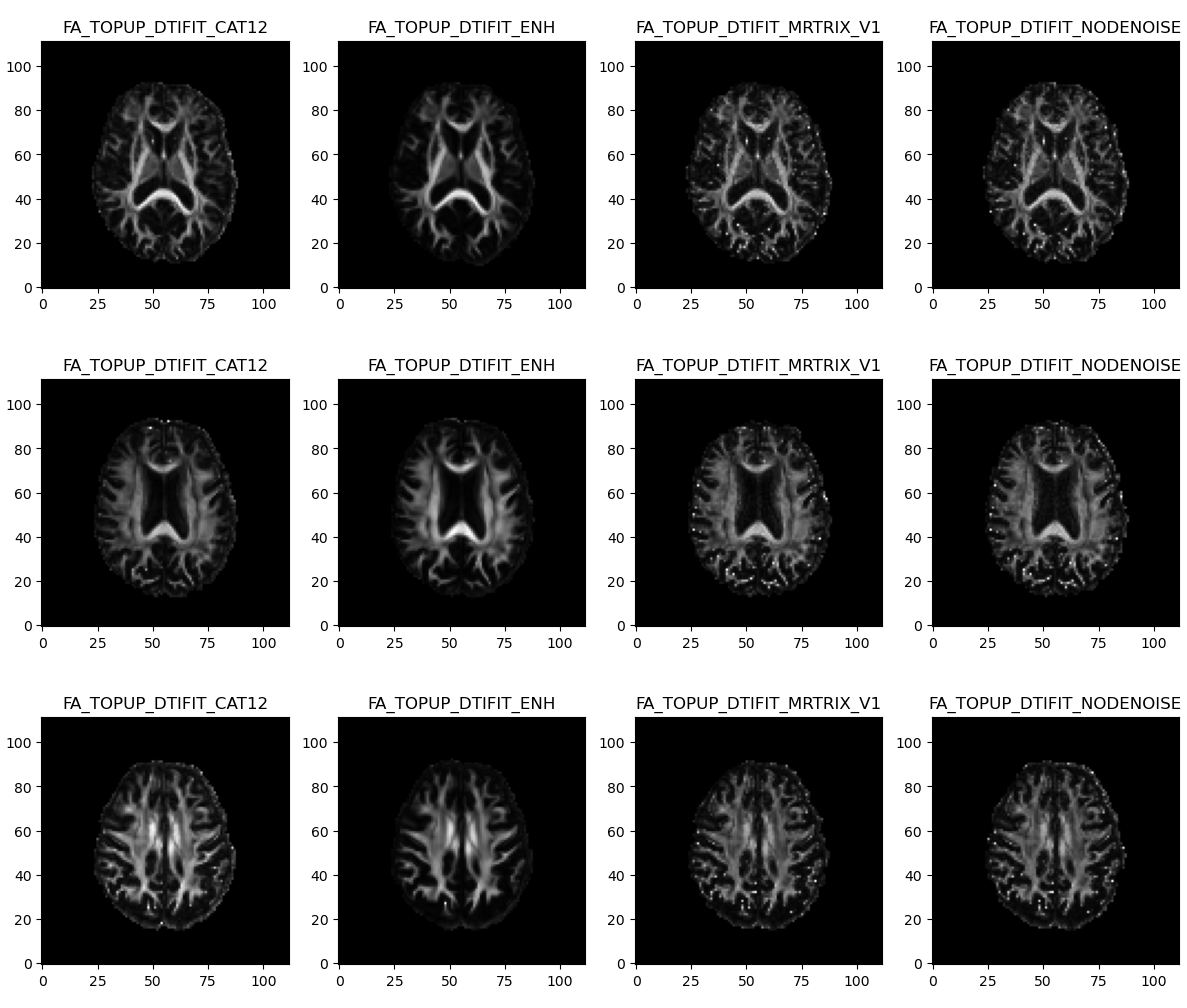
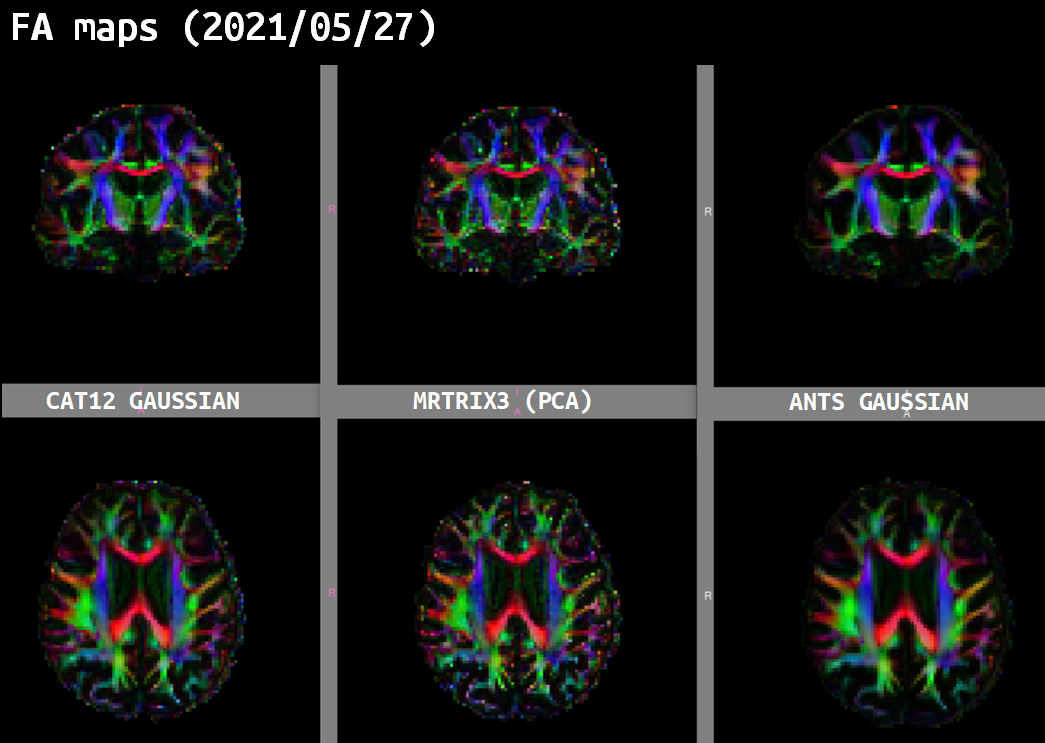
Same observations with FA maps and RGB tensors obtained from NLM-denoised data which looked quite smoother than using MPPCA denoising.
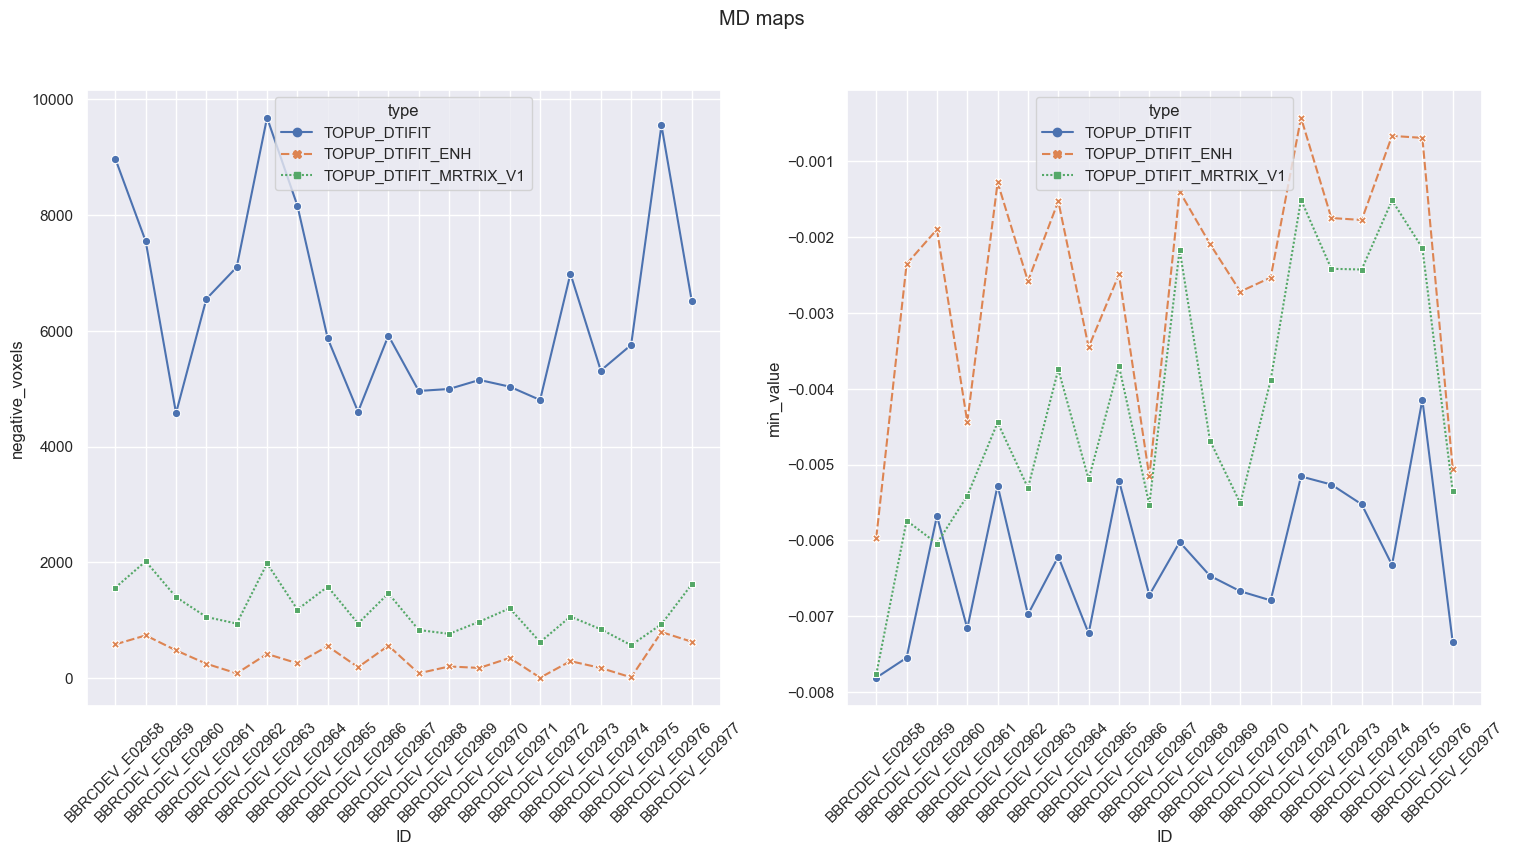
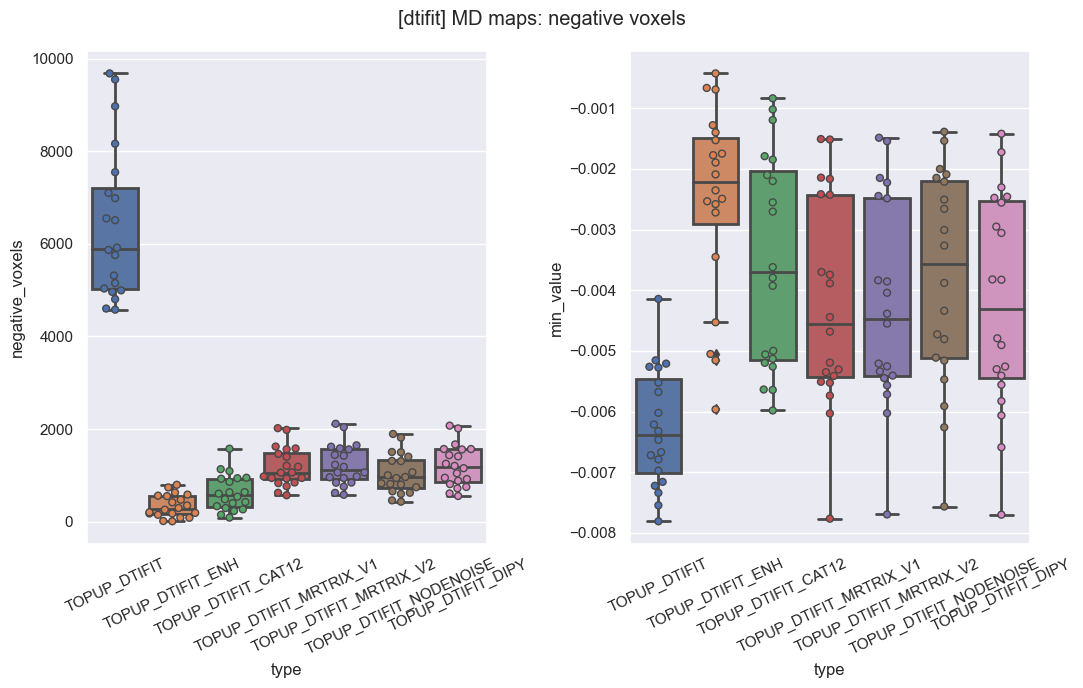
One big concern of ours was to make sure resulting MD maps would not include large areas with negative voxels. In that respect, NLM with Gaussian model (orange) systematically gave the lowest number of negative voxels and the minimum value closest to zero, compared to NLM with Rician model (blue) and MPPCA (green).
In the end NLM with Rician model (orange) was the only method yielding so many negative voxels in MD.
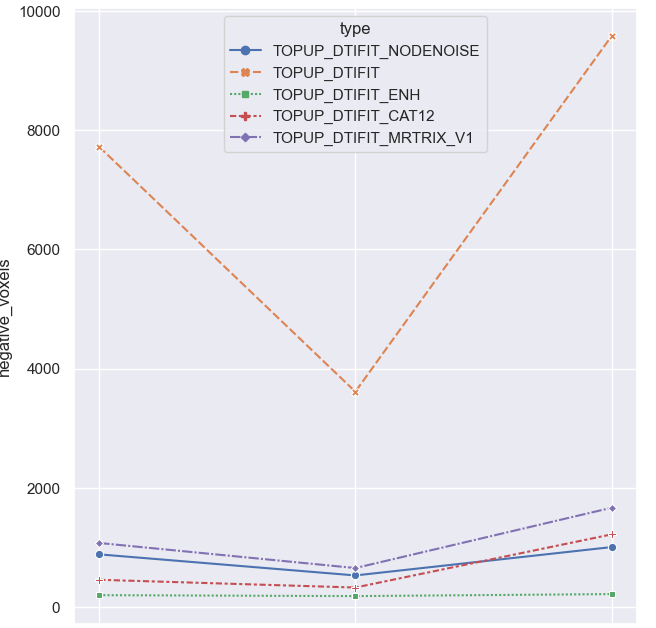
More techniques: same observation.
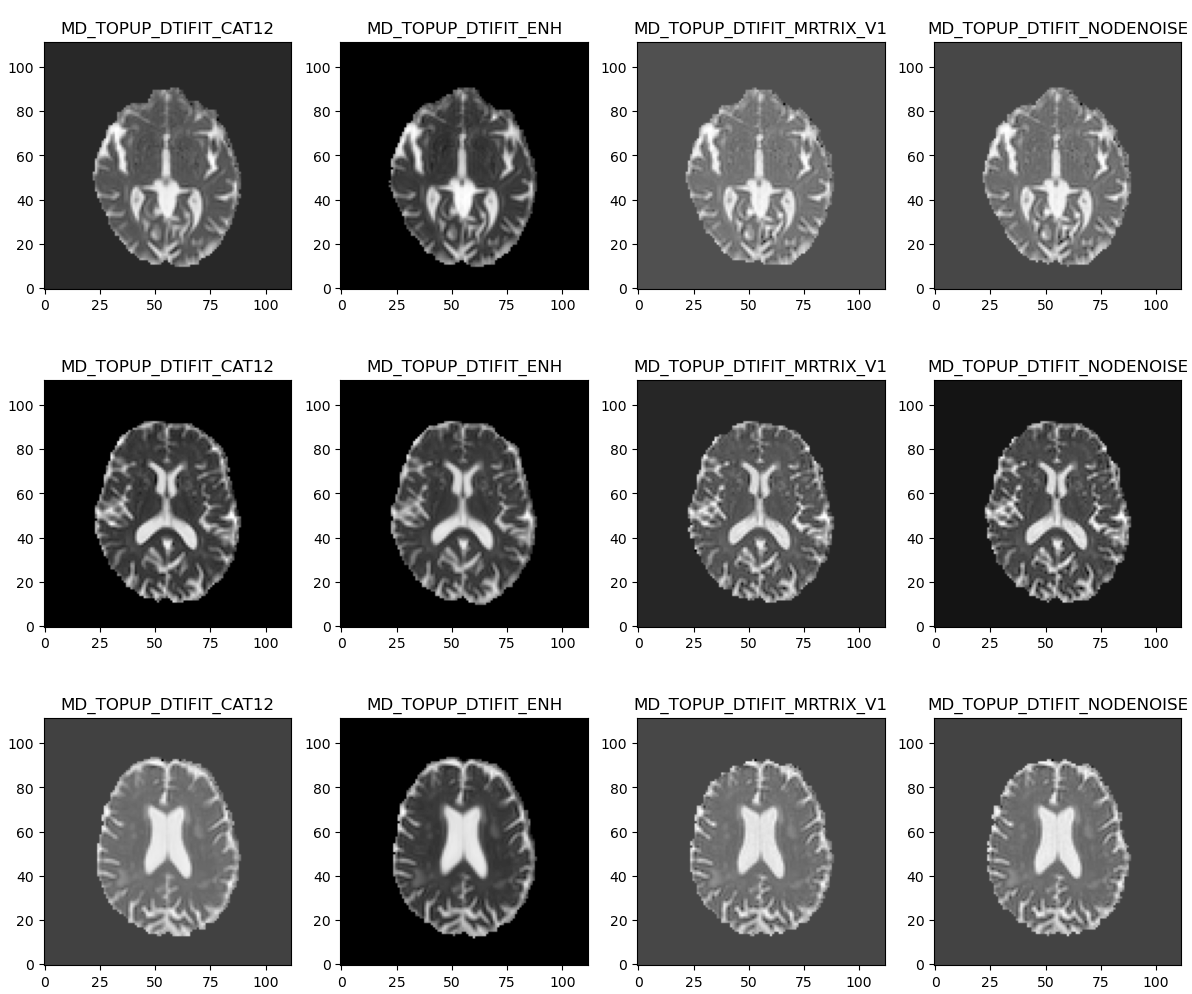
We also made sure that those large initial periventricular negative areas disappeared from the final MD maps.
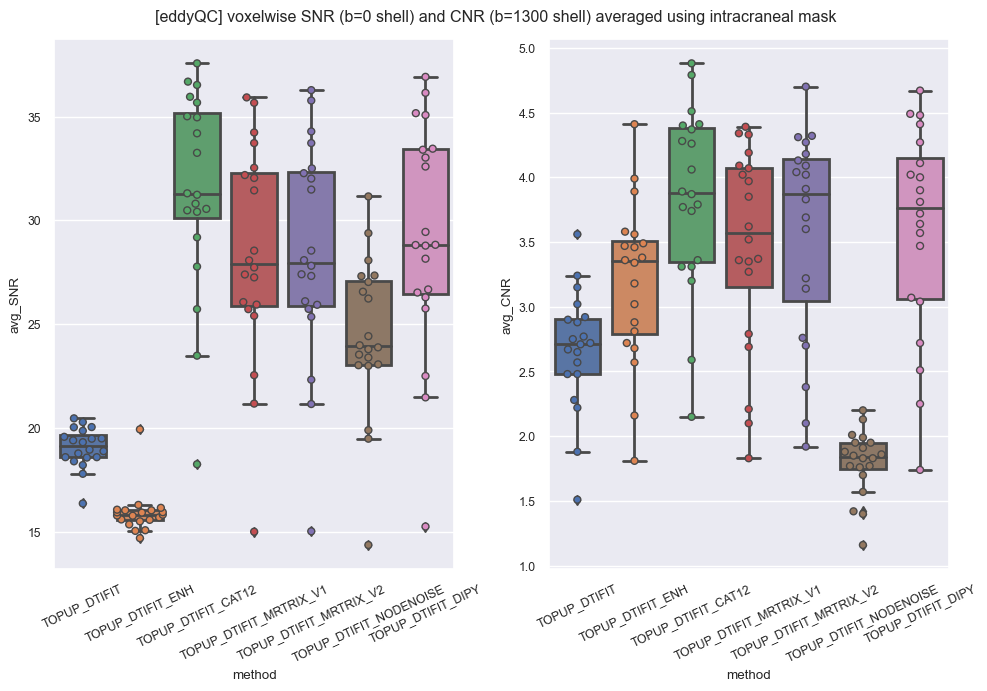
Signal-to-noise/carrier-to-noise ratios (SNR/CNR) is also found higher using MPPCA (or CAT12) than using NLM with ANTs Rician and Gaussian (blue and orange respectively).
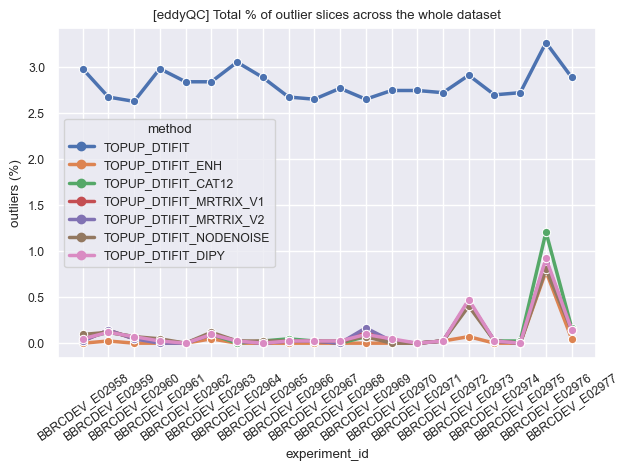
Finally we looked at the estimation of outlier slices in each processed volume as provided by eddyQC and realized that using anything but NLM-Rician improves that QC metric. To some extent NLM-Gaussian could be considered a winner in this test but it might be thought as a logical consequence of the smoother aspect of the resulting images. Less outliers but less anatomical details as well.
The conclusion (current pipeline)
Some modern, mature, maintained and easy-to-plug implementations are now available for denoising of DWI. This includes at least packages such as dipy or mrtrix3. In application to our tests they both yielded good results based on QC metrics and visual inspection. Those were primarily designed for DWI, contrary to denoising based on NLM as done in other toolboxes (CAT12, ANTs) which are mainly oriented towards T1.
We finally selected the following pipeline and implemented a set of systematic checks for quality control, based on validators (as described in 4).
mrtrix MPPCATOPUP based on the normal and reverse-encoded B0 mapsFSL BET)FSL eddy)TOPUP and eddy tools (FSL eddyQC)).FSL DTIFIT)FSL fslmaths)Steps for automatic QC (bbrc-validator):
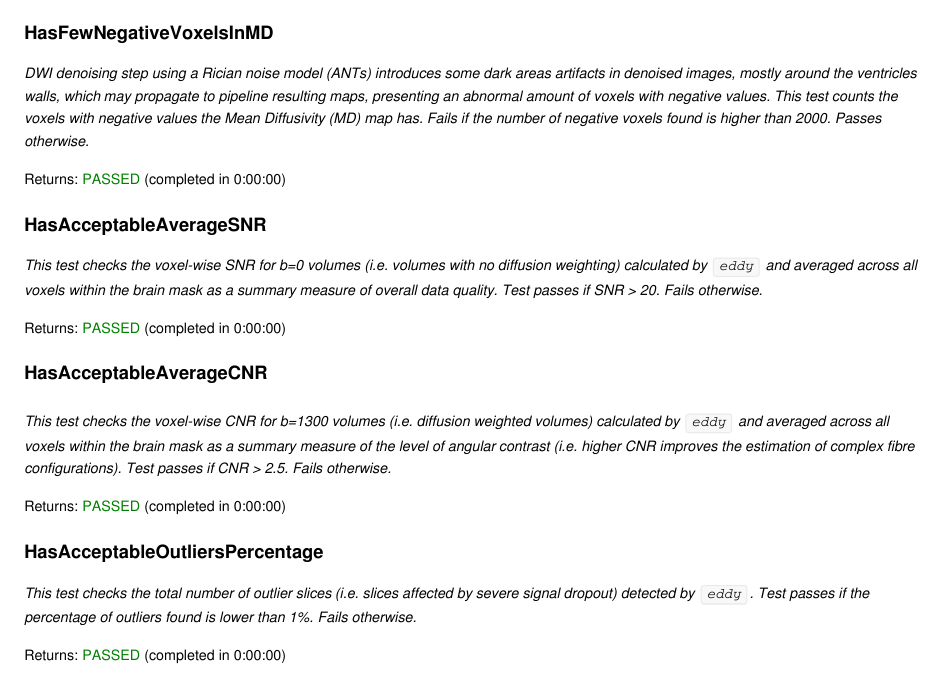
DTIFITValidator.HasFewNegativeVoxelsInMDeddyqc and check that they are within a certain range DTIFITValidator.HasAcceptableAverageSNR DTIFITValidator.HasAcceptableAverageCNReddy) is under 1% DTIFITValidator.HasAcceptableOutliersPercentageThese checks will systematically be performed on any new execution of the DWI processing pipeline. Resulting validators now include the following additional entries, to prevent from any future regression.
bx dtifit report [RESOURCE_ID])Huge kudos and most credits to Jordi Huguet (Barcelonaβeta Brain Research Center) who took all the burden of running these tests with those different techniques, extracting metrics for comparison and analyzing them. All the figures in this post are attributed to his work.
References
1.↑ J. Manjón, P. Coupé, L. Concha, A. Buades, L. Collins, M. Robles, Diffusion Weighted Image Denoising Using Overcomplete Local PCA, PLOS One (2013)
2.↑ P. Coupé, J. Manjón, M. Robles, L. Collins, Adaptive Multiresolution Non-Local Means Filter for 3D MR Image Denoising, IET Image Processing, Institution of Engineering and Technology (2011)
3.↑ J. Veraart J, DS. Novikov, D. Christiaens, B. Ades-Aron, J. Sijbers, E. Fieremans, Denoising of diffusion MRI using random matrix theory Neuroimage (2016)
4.↑ J. Huguet, C. Falcon, D. Fusté, S. Girona, D. Vicente, JL Molinuevo, JD Gispert, G. Operto for the ALFA Study, Management and Quality Control of Large Neuroimaging Datasets: Developments From the Barcelonaβeta Brain Research Center, Front. in Neurosc. (2021)
Please let me know if you liked this post by clicking the button below.